서론
웹 개발자로서 웹 애플리케이션을 만들 때 신경써야할 것은 서비스 로직 뿐만이 아니다. 웹 애플리케이션의 사용자는 누구인지(일반인? 외부시스템?), 어떤 경로로 애플리케이션에 요청을 할 지(Load Balancing, Fire Wall), 요청 수나 TPS 등 많은 것들을 고려해야한다. 이번에 소개할 spring-boot-actuator라는 모듈은 애플리케이션의 상태를 종합적으로 정리하여 우리에게 제공해준다. 본문에서는 Spring Boot Samples에 있는 프로젝트 중에서 spring-boot-sample-actuator-ui를 가져와 살짝 소스를 수정하여 actuator가 무엇이고 어떤 일 해주는지 알아보려한다.
샘플 프로젝트로 Actuator 체험해보기
소스 수정
spring-boot-sample-actuator-ui에서 소스를 다운받아 pom.xml 파일의 parent를 수정하여 바로 실행해볼 수 있다. 여기서는 sprint-boot-starter-security도 제외시키겠다.
1 | <!-- parent를 spring-boot-starter-parent로 수정 --> |
applcation.properties
1 | =user |
앞서 security 의존성을 없앴기 때문에 spring-security가 동작하지는 않는다.
실행
maven의 spring-boot:run이나 직접 SampleActuatorUiApplication의 main()을 호출하여 서버를 띄운 후 GET /actuator를 실행해보자. 아래와 같은 json 정보를 얻을 수 있다.(몇몇 부분은 생략했다)
1 | { |
위와 같은 내용의 애플리케이션의 상태를 확인할 수 있다. 예를 들어 GET /actuator/health를 실행해보자. 아래와 같이 현재 애플리케이션의 health 상태를 알 수 있다.
1 | {"status": "UP"} |
혹은 GET /actuator/metrics/jvm.threads.live를 요청해보자. 현재 JVM의 활성화된 Thread의 정보를 가져올 수 있다.
1 | { |
GET /actuator/heapdump나 GET /actuator/threaddump를 요청하면 dump 파일을 받을 수도 있다.
이러한 애플리케이션의 상태 정보를 아무에게나 노출하면 안될 것 같다. 확인된 사용자에게만 actuator 정보를 노출하고자 할 때에는 간단하게 두 가지 방법을 고려할 수 있다.
management.server.port,management.server.address값을 수정해서 해당 ip, address에 한해 ACL를 걺spring-security를 이용하여management.endpoints.web.base-path(기본값 /actuator)에 대해 권한을 확인
물론 두 방법을 동시에 사용할 수도 있다.
그래서 Spring Boot Actuator란
간단히 말하자면 Spring Boot Application의 상태를 관리해준다.
- Spring Boot Application의 상태 정보(health, properties, beans, 구동된 AutoConfiguration 목록 등)를 다룰 수 있도록 자동 설정.
- 각종 추상화 클래스(HealthIndicator 등)을 제공하여, 상태 정보를 변경할 수 있도록 Service를 제공.
써먹을 만한 설정과 사용자화 가능한 것들
노출할 항목 설정
앞서 본 샘플에서는 많은 정보들이 노출되고 있었다. auditevents, beans, health, env 등등, 필요해 보이는 것부터 T.M.I.까지 있다. application.properties에서 management.endpoints.web.exposure.include에 필요한 endpoint의 id를 설정할 수 있다. endpoint의 목록은 레퍼런스 문서를 참고하자.
예제: health와 metrics 정보만 노출
1 | management.endpoints.web.exposure.include=health,metrics |
Endpoint 경로 설정
앞에서 소개한 것과 같이 management.endpoint.web.base-path(기본값 /actuator)를 수정하여 base-path를 수정할 수 있다. 그 외에도 management.endpoints.web.path-mapping.<id>값을 수정하여, 특정 id의 endpoint의 경로를 수정할 수 있다.
예제: health의 경로를 /monitor/healthcheck로 변경
1 | management.endpoints.web.base-path=/monitor |
CORS
spring-boot-actuator는 기본적으로 클라우드 환경에서 관리자가 각종 애플리케이션의 상태를 파악하기 쉽도록 설계되어 있다. 때문에 필요한 경우 외부 UI를 구성한 다른 도메인명을 가진 Web Application에서 각각의 서비스 애플리케이션의 상태를 파악하기 위해서 actuator 정보를 요청할 수도 있다. 이럴때 CORS를 설정하여 사용할 수 있다.
예제: http://other-domain.com 의 GET, POST요청을 허용
1 | management.endpoints.web.cors.allowed-origins=http://other-domain.com |
Health Endpoint
Details
Health Endpoint는 위 샘플에서 소개된 것 외에도 사실상 많은 정보들을 내보일 수 있다. 이전의 샘플 소스로 돌아가서 pom.xml과 application.properties를 아래와 같이 수정해보자.
pom.xml: jpa와 h2 database 의존성 추가
1 | <dependency> |
application.properties: 상세 정보를 노출하도록 변경
1 | management.endpoint.health.show-details=always |
다시 애플리케이션을 실행시킨 후 GET /actuator/health 요청을 보내보면 아래와 같이 응답이 온다.
1 | { |
애플리케이션에서 의존하고 있는 시스템의 Health check도 함께 파악할 수 있다. DataSource 외에도 Disk, Cassandra, ElasticSearch, Redis 등의 health check를 확인할 수 있다.
사용자 정의 Health Indicator
Health Endpoint의 내용은 HealthIndicator를 구현하여 정의할 수 있다.
HealthIndicator
1 |
|
아래는 간단하게 health indicator를 구현한 예제이다.
PUT /actuator/health/up: UP 상태로 변경PUT /actuator/health/down: DOWN 상태로 변경PUT /actuator/health/maintenance: 점검 상태로 변경
1 |
|
각 URL에 맞춰서 health의 값을 변경한다. 기본적으로 up, down, out-of-service, unkwon의 상태값이 존재하지만 maintenance의 상태값은 없다. 사실 의미상 out-of-service와 동일하지만, 사용자화를 할 수 있다는 걸 보이기 위해서 새로 만들었다. 새로운 상태값을 만들어 actuator에서 인식하도록 만들려면 application.properties를 수정해야한다.
1 | # 심각도에 따른 순서 |
이제 애플리케이션을 실행하여 PUT /actuator/health/maintenance를 요청한 후 GET /actuator/health로 확인해보자 아래와 같이 나온다.
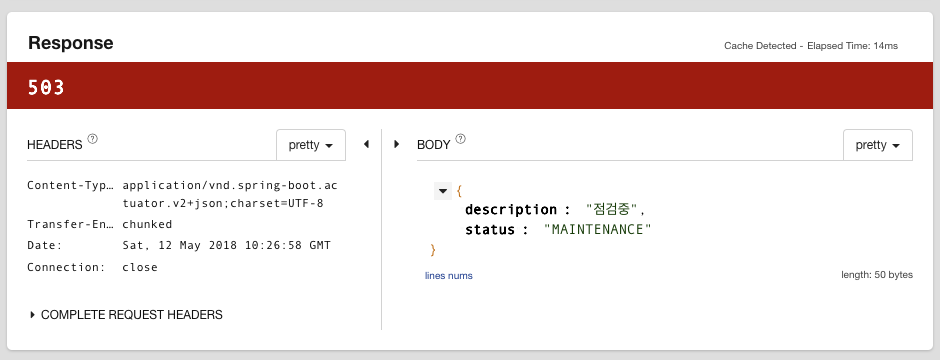
HealthIndicator를 구현하며, management.endpoint.health.show-details=always가 설정된 경우
사용자화한 항목을 하나의 상세로 표시해준다.
1 | { |
Metrics
간단히 말하자면 시계열 지표로 활용할 수 있는 정보를 관리한다. 아래는 그 일부이다.
- JVM 정보
- thread 수
- GC 정보
- heap 정보
- DBCP 정보
- PROCESS 관련 정보
- CPU
- USAGE
- LOAD
- FILE
- 최대 사용가능한 File Descriptor 수
- 현재 사용중인 File Descriptor 수
사용자 정의 Metircs
Metrics의 정보도 사용자 정의할 수 있다. 예를 들어 현재 처리중인 동시 요청 수나 분당 요청 처리량 등을 표시할 수 있다. 방법은 간단하다. MeterRegistry를 주입받아 사용하면 된다. 아래는 처리중인 동시 요청 수에 대한 예제이다.
1 | public class ConcurrentTransactionCountInterceptor extends HandlerInterceptorAdapter { |
GET /actuator/metrics/transaction.current.count를 호출하면 아래와 같이 나온다.
1 | { |
마무리
Spring Boot Actuator에 대해서 간략하게 살펴보았다. actuator에서는 이외에도 많은 기능을 제공해주지만, 자주 사용할 것 같은 기능 위주로 살펴봤다.
actuator는 기본적으로 애플리케이션의 상태를 조회하고, 변경할 수 있도록 기능을 추상화하여 정의하고 있다. 추상화된 기능들에 대한 간단한 구현체들을 제공해주며, 개발자로 하여금 사용자 정의를 통해 더욱 상세한 설정을 할 수 있도록 가능성을 열어두었다. actuator로 인해 프로젝트 내에서 애플리케이션 관리를 통합해서 사용할 수 있으며, 이는 클라우드 환경에서 애플리케이션을 관리하는 데 매우 유용하게 사용할 수 있다. Load Balancing은 물론이거니와 필요시 Instance를 자동으로 배포, 제거하는 데에 유용한 정보들을 제공해줄 수 있다.
애플리케이션 개발팀과 인프라스트럭처 관리팀이 나누어진 경우, 인프라스트럭처 관리팀에서 정해둔 정책이 있다면 spring-boot-starter를 사용자 정의하여 actuator를 회사, 혹은 팀 단위에 맞춰서 미리 정의해서 사용해보자. 그렇게 되면 개발팀은 서비스 로직에만 신경쓸 수 있게 될 것이다.